IsoLab
irm-EAMS (δ13C and δ15N)
CO2 in-air (δ13C and δ18O)
O2/N2 in air (+ δ18O of O2 in air or Ar/N2)
Laser Ablation
GasBench
TC/EA ('Pyrolysis', δ2H and δ18O)
Acid reaction and air mixing system (ARAMIS) (δ13C and δ18O)
irm-EAMS (δ13C and δ15N)
Bulk material from soil, plants and.. other sources that can be combusted quantitatively to CO2, N2 and H2O (+ other oxides if applicable) is measured using the combination of an elemental analyzer (NA 1110, CE Instruments, Milan, Italy) with an isotope ratio mass spectrometer (Delta C or DELTA+XL, Finnigan MAT, Bremen, Germany). With the current setup, up to 76 analyses can be made per day. A major limitation is the limited number of samples that can be positioned into the autosampler (32 capsules). Throughput can be improved to about 100 analyses per day using the second stage of the autosampler. However, our experience is that this must be done with care. Occasionally, mechanical failure of the transport mechanism leads to samples misdrops. This phenomenon prohibits the use of more than two trays.
In every sequence we use one dedicated sample position for determining a QA standard (quality assurance). With this standard which does not enter the reference calculation we monitor the long term performance of the irm-EAMS line (Figure 2.5.1-1 for δ13C and Figure 2.5.1-2 for δ15N). The data in the figures are representative for all measurements made on our irm-EAMS systems since we started routine analyses in 1998 until recently. The performance or quality control chart is the perfect tool to monitor the status of the laboratory reference materials. Any contamination in either the lab standard or the QA standard will show up as a step jump. Slow long term alteration (e.g. evaporative loss in water standards) will show as a drift. The generation of performance charts and other methodological aspects of sample analysis in stable isotope ratio laboratories has been summarised in a review:
Roland A. Werner and Willi A. Brand, Referencing Strategies and Techniques in Stable Isotope Ratio Analysis, Rapid Comm. Mass Spectrom. 15 (2001) 501-519
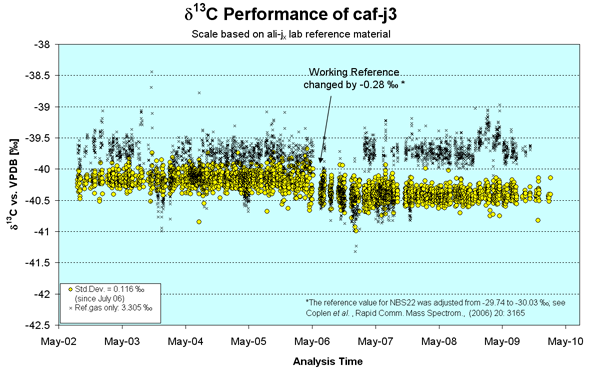
Performance Chart: δ13C-values of a quality control standard as a function of measurement time. The scale is based on reference material that went through the same preparation channel as the QA standard. Each sequence of 32 samples measured holds one QA standard that is represented by a single point. The data were produced by four major operators on four different mass spectrometers with three different interfaces. The difference between the ref.gas only data and the circles highlight the importance of the principle to handle reference and sample through the same inlet line.
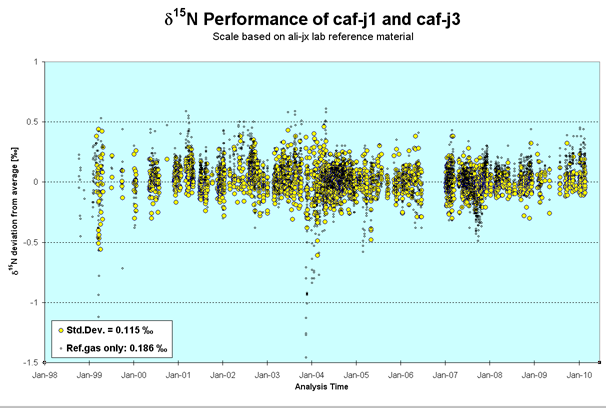
Performance Chart: δ15N-values of Caf-J1.