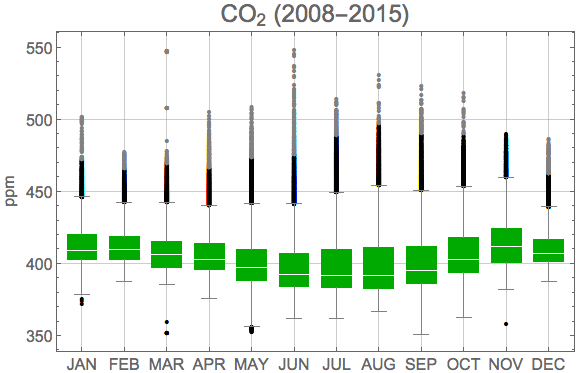
Climatology of measurements at the MPI roof (2003-2015)
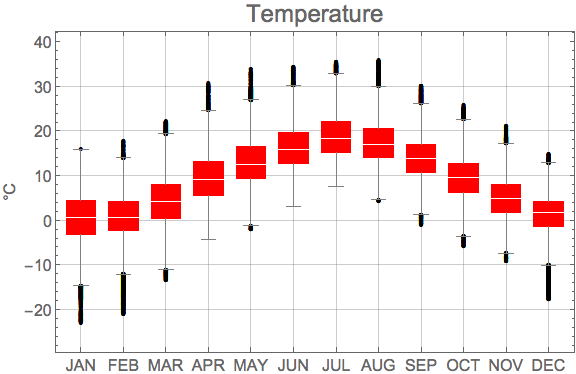
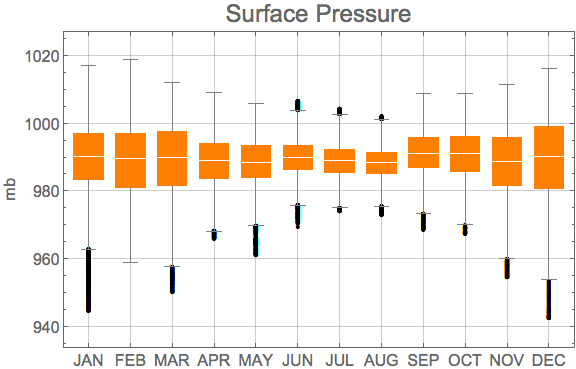
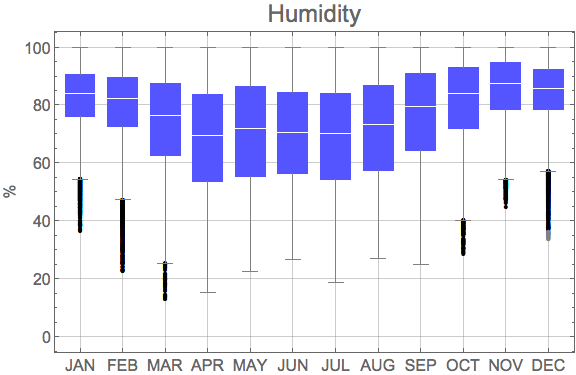
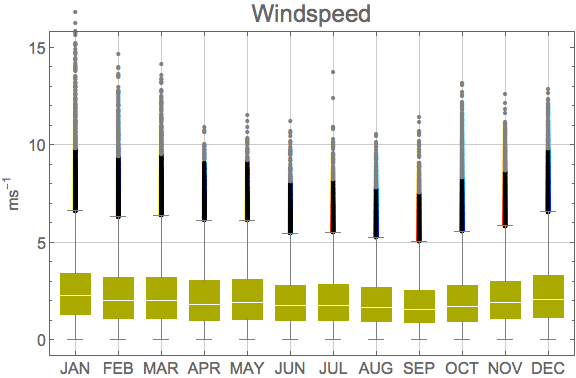
Statistics of weather elements recorded at the MPI weather station. The following box and whisker plots indicated the distribution of the measurements within each month. "Outliers" (black dots) are defined as lying more than 1.5 times the interquartile range, "far outlieras" (gray dots) more than 3 times the interquartile range away from the median.
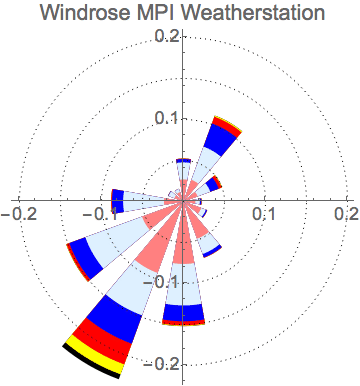
The following windrose shows the relative distribution of the winddirection in 30° sectors, and within each sectors the relative distribution of the windspeed (see colorbar). Computed from all available 10' measurements.
 |
 |
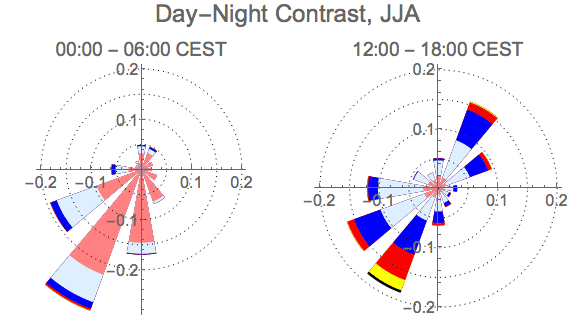
The local topography heavily influences the distribution of the winddirections (SW-NE). In summer it also induces a strong diurnal effect apparent: see the following windroses, computed from the late night (00:00-06:00 CEST) and the afternoon (12:00-18:00 CEST) measurements measured during June-August. While the daytime distribution resembles the overall distribution (see above), during the night the winds are generally weaker and predominantly from the S-SW direction.
 |
 |
Last Update: Sun 19 Apr 2015 09:19:11
Links
![]()
![]()
![]()