Data Visualization Project


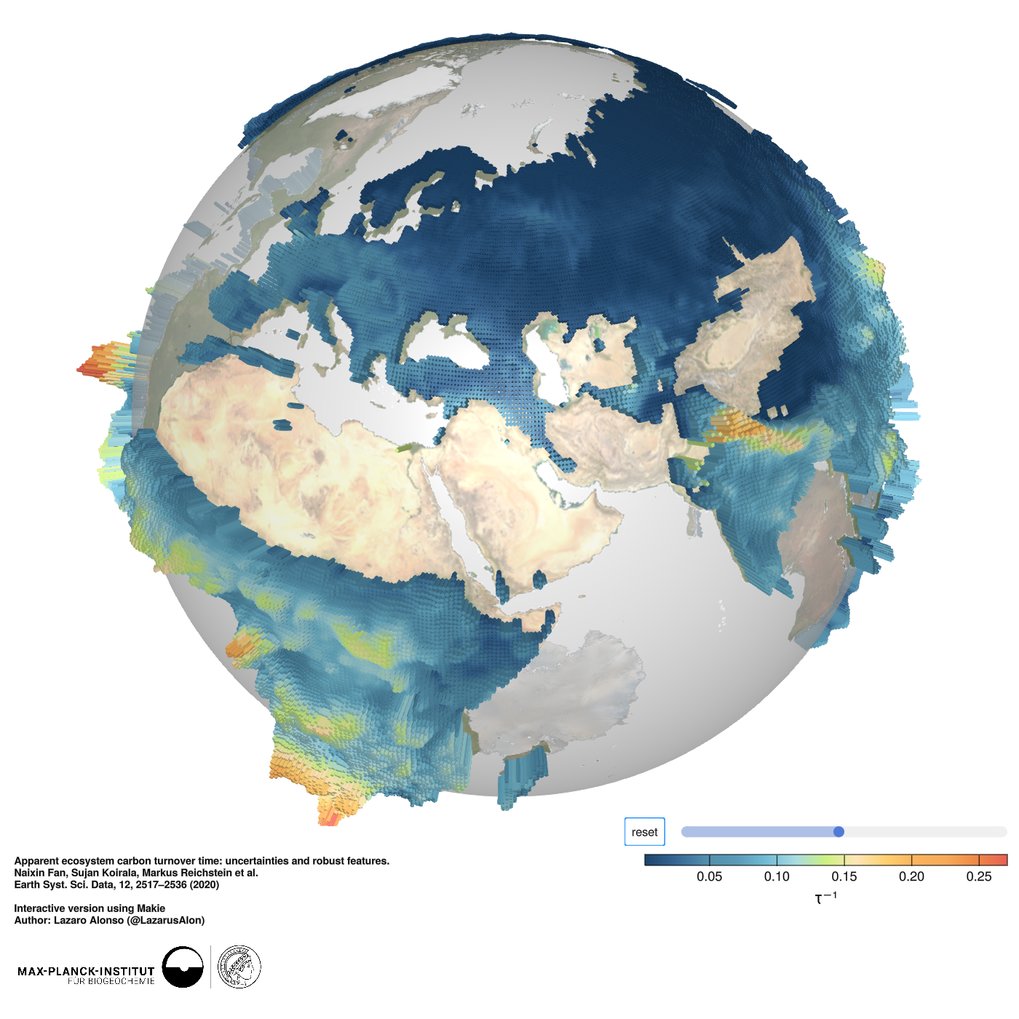
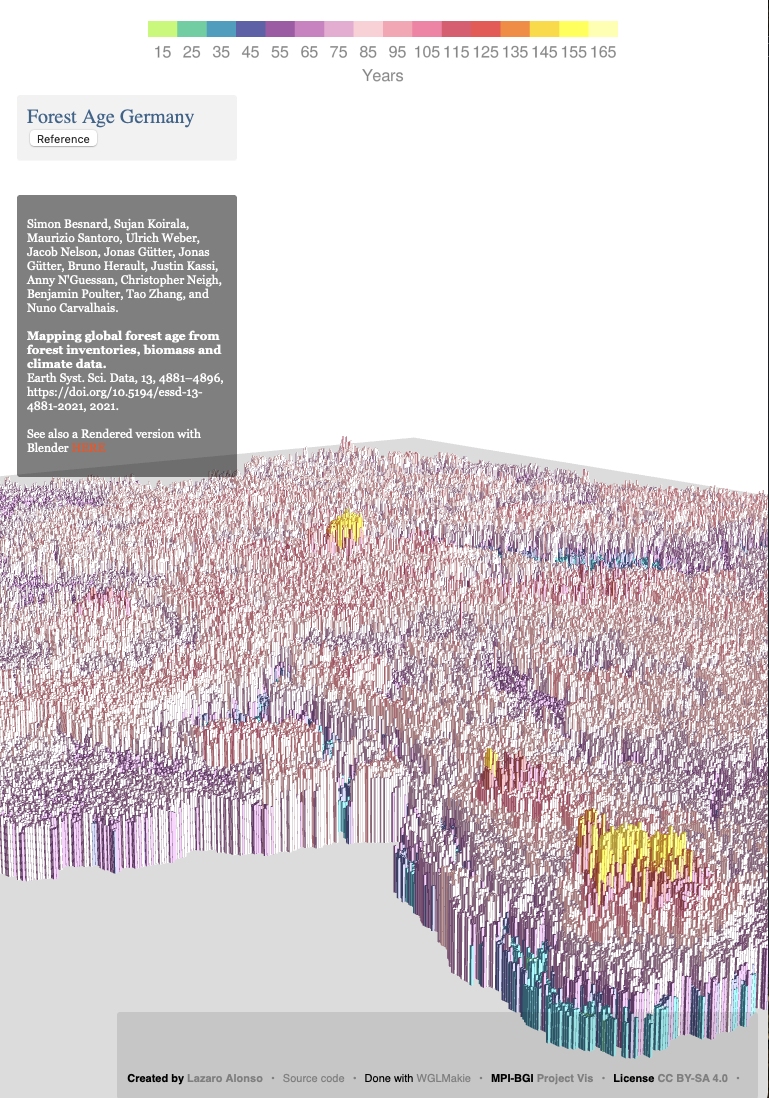
Ecosystem Carbon Decomposition Rate
License CC BY-SA 4.0
Mission
The Data Visualization Project aims at contributing to research via Visual Analytics as well as to Scientific Communication / Dissemination by working closely with other Scientists and Research groups at the department, creating movies/animations, interactive apps and high quality images. Most projects are done with internal data products and some are external due to their social importance. This allow us to promote our research within the academic community as well as to the general public.
Latest entries


Seasfire project. Chunking one variable.
https://zenodo.org/record/7108392
https://zenodo.org/record/7108392
© Lazaro Alonso


Seasfire project. Variable list.
https://zenodo.org/record/7108392
https://zenodo.org/record/7108392
© Lazaro Alonso
Images and interactive apps
Videos / Animations

DeepCube
Large datasets on the DeepCube project. Showcasting operations on chuncks of data across different dimensions, i.e. time, space and in parallel.
https://www.youtube.com/watch?v=5s86y8lkDtk
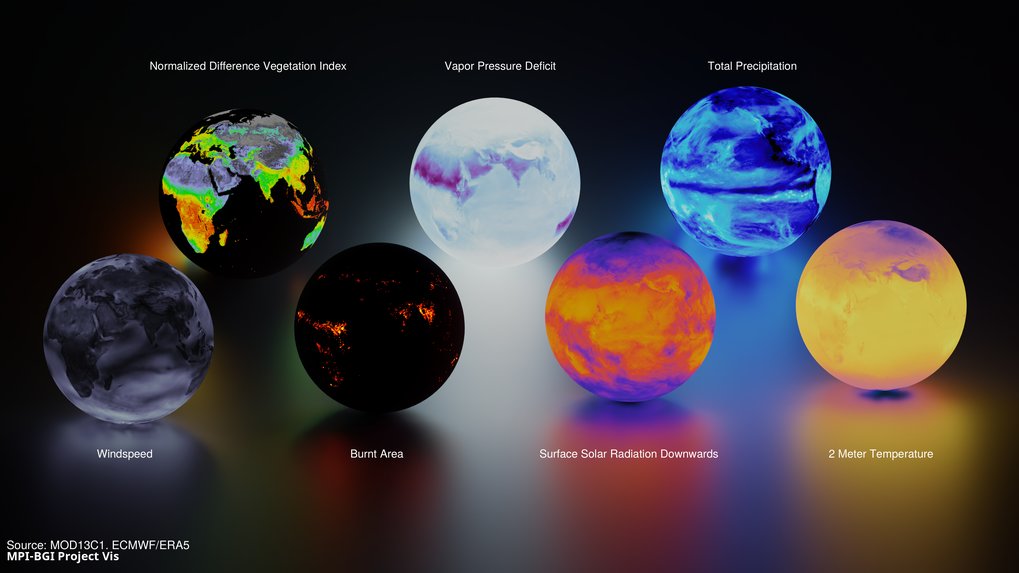
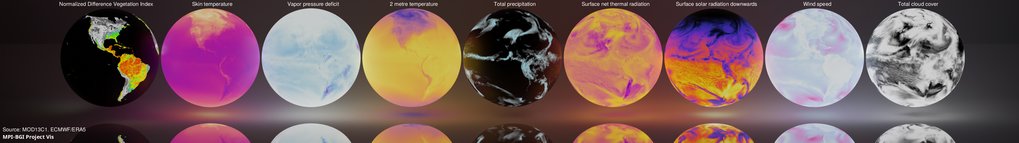
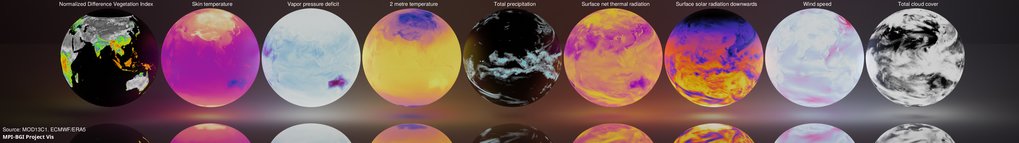
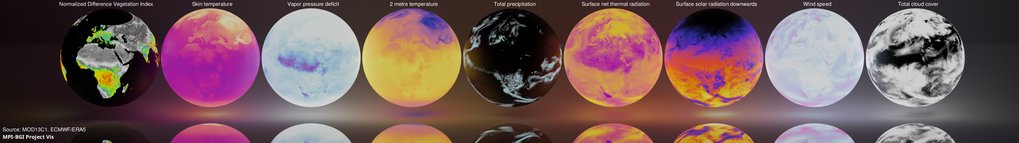
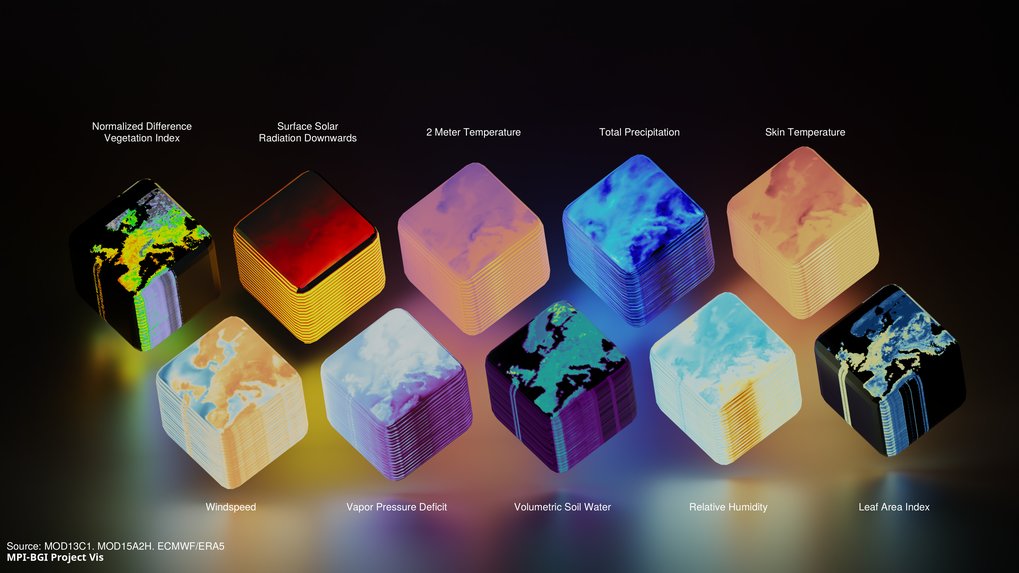
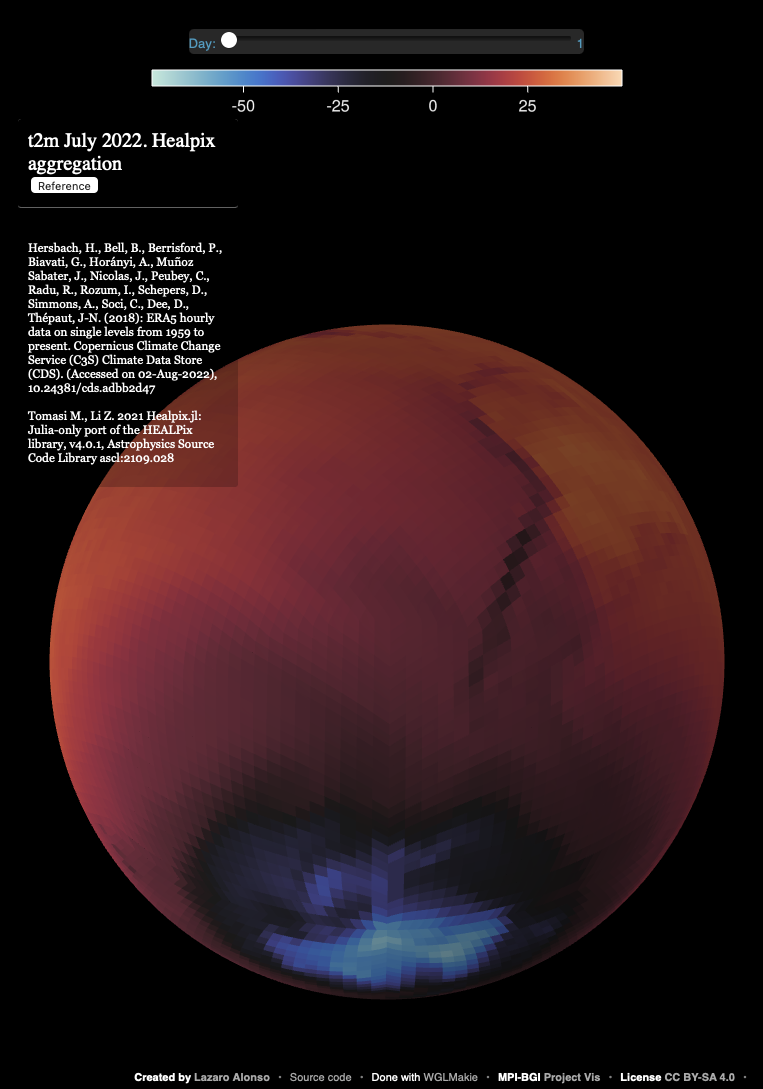
![Didan, K. (2015). MOD13C1 MODIS/Terra Vegetation Indices 16-Day L3 Global 0.05Deg CMG V006 [Data set]. NASA EOSDIS Land Processes DAAC. https://doi.org/10.5067/MODIS/MOD13C1.006<br /><br />Hersbach, H., Bell, B., Berrisford, P., Biavati, G., Horányi, A., Muñoz Sabater, J., Nicolas, J., Peubey, C., Radu, R., Rozum, I., Schepers, D., Simmons, A., Soci, C., Dee, D., Thépaut, J-N. (2018): ERA5 hourly data on single levels from 1959 to present. Copernicus Climate Change Service (C3S) Climate Data Store (CDS). 10.24381/cds.adbb2d47 ](/5235672/original-1658316558.webp?t=ZXlKM2FXUjBhQ0k2TVRBNE1Dd2labWxzWlY5bGVIUmxibk5wYjI0aU9pSjNaV0p3SWl3aWIySnFYMmxrSWpvMU1qTTFOamN5ZlE9PS0tYjcyMzY5OTNmMWE4YjY3ZDU5MThmZTQ1N2M2NTMyMzdhZDRkNDE0MA)
MODIS and ERA5 for global observations
Didan, K. (2015). MOD13C1 MODIS/Terra Vegetation Indices 16-Day L3 Global 0.05Deg CMG V006 [Data set]. NASA EOSDIS Land Processes DAAC. https://doi.org/10.5067/MODIS/MOD13C1.006
Hersbach, H., Bell, B., Berrisford, P., Biavati, G., Horányi, A., Muñoz Sabater, J., Nicolas, J., Peubey, C., Radu, R., Rozum, I., Schepers, D., Simmons, A., Soci, C., Dee, D., Thépaut, J-N. (2018): ERA5 hourly data on single levels from 1959 to present. Copernicus Climate Change Service (C3S) Climate Data Store (CDS). 10.24381/cds.adbb2d47
https://www.youtube.com/watch?v=pQ0x8spfJ2Q
Hersbach, H., Bell, B., Berrisford, P., Biavati, G., Horányi, A., Muñoz Sabater, J., Nicolas, J., Peubey, C., Radu, R., Rozum, I., Schepers, D., Simmons, A., Soci, C., Dee, D., Thépaut, J-N. (2018): ERA5 hourly data on single levels from 1959 to present. Copernicus Climate Change Service (C3S) Climate Data Store (CDS). 10.24381/cds.adbb2d47

Largest World Fires
Giglio, L., J. T. Randerson, and G. R. van der Werf (2013), Analysis of daily, monthly, and annual burned area using the fourth-generation global fire emissions database (GFED4), J. Geophys. Res. Biogeosci., 118, 317–328.
https://www.youtube.com/watch?v=qqk697RNh44

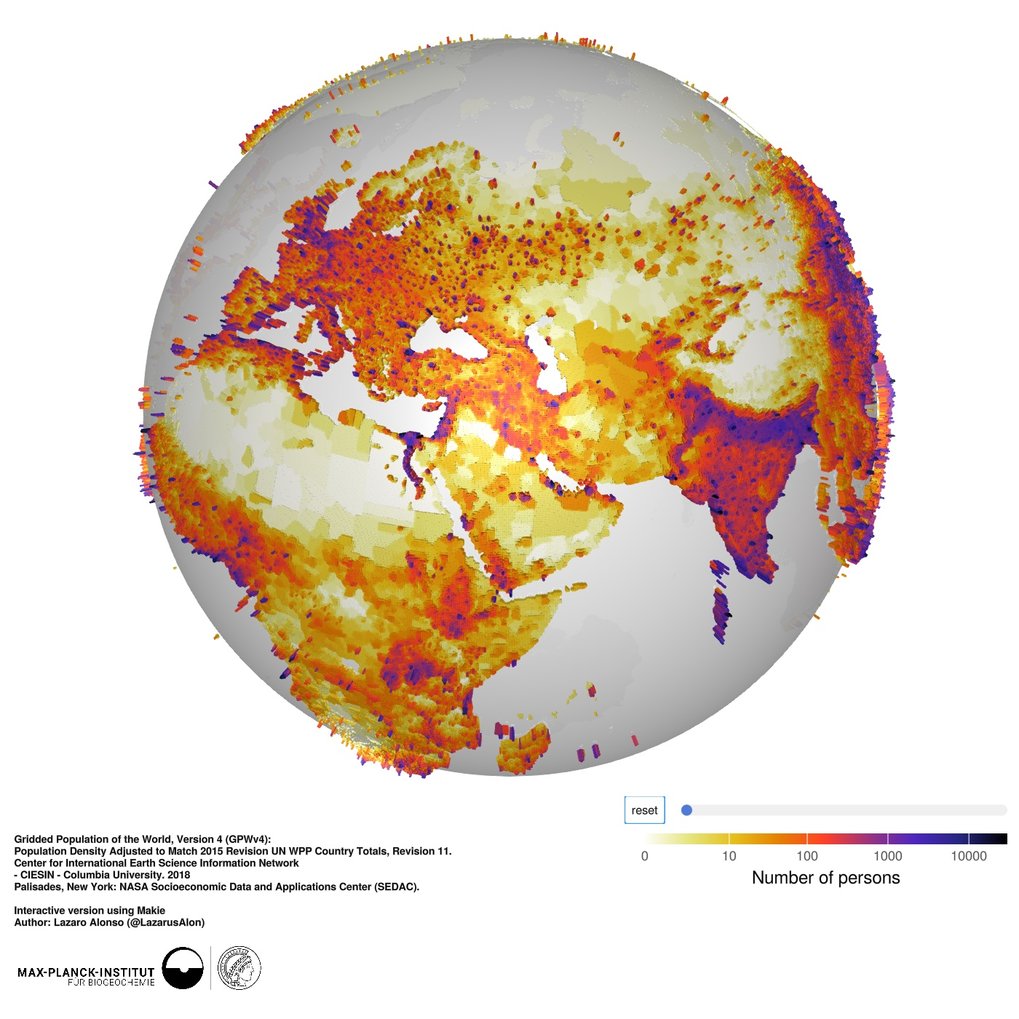
![Global 30 Arc-Second Elevation (GTOPO30) Digital Object Identifier (DOI) number: /10.5066/F7DF6PQS<br /><br />Friedl, M., Sulla-Menashe, D. (2019). MCD12Q1 MODIS/Terra+Aqua Land Cover Type Yearly L3 Global 500m SIN Grid V006 [Data set]. NASA EOSDIS Land Processes DAAC. https://doi.org/10.5067/MODIS/MCD12Q1.006](/5235891/original-1658330443.webp?t=ZXlKM2FXUjBhQ0k2TVRBNE1Dd2labWxzWlY5bGVIUmxibk5wYjI0aU9pSjNaV0p3SWl3aWIySnFYMmxrSWpvMU1qTTFPRGt4ZlE9PS0tZDcxYTAyMTczM2M5YzI2NjFiMTk0YWIzZWM5MmQxM2ZlNmE2M2E2OA)
Topography and vegetation types
Global 30 Arc-Second Elevation (GTOPO30) Digital Object Identifier (DOI) number: /10.5066/F7DF6PQS
Friedl, M., Sulla-Menashe, D. (2019). MCD12Q1 MODIS/Terra+Aqua Land Cover Type Yearly L3 Global 500m SIN Grid V006 [Data set]. NASA EOSDIS Land Processes DAAC. https://doi.org/10.5067/MODIS/MCD12Q1.006
https://www.youtube.com/watch?v=D9SQEEuTSDE
Friedl, M., Sulla-Menashe, D. (2019). MCD12Q1 MODIS/Terra+Aqua Land Cover Type Yearly L3 Global 500m SIN Grid V006 [Data set]. NASA EOSDIS Land Processes DAAC. https://doi.org/10.5067/MODIS/MCD12Q1.006